1、将harbor的metrics打开
# values.yaml
···
metrics:     enabled: true             # 打开core:path: /metricsport: 8001registry:path: /metricsport: 8001jobservice:path: /metricsport: 8001exporter:path: /metricsport: 8001···# 更新helm
helm upgrade harbor -n harbor -f values.yaml .
2、修改Prometheus的values文件
# values.yaml
···prometheus.yml:rule_files:- /etc/config/recording_rules.yml- /etc/config/alerting_rules.yml## Below two files are DEPRECATED will be removed from this default values file- /etc/config/rules- /etc/config/alertsscrape_configs:                            - job_name: prometheusstatic_configs:- targets:- localhost:9090- job_name: 'harbor'                        # 往这添加一个harbor的jobstatic_configs:- targets: ['harbor.xwk.local']         # harbor的访问地址metrics_path: /metricstls_config:insecure_skip_verify: true              # 跳过证书认证
···# 更新
helm upgrade prometheus -n prometheus -f values.yaml .
3、访问Prometheus的页面
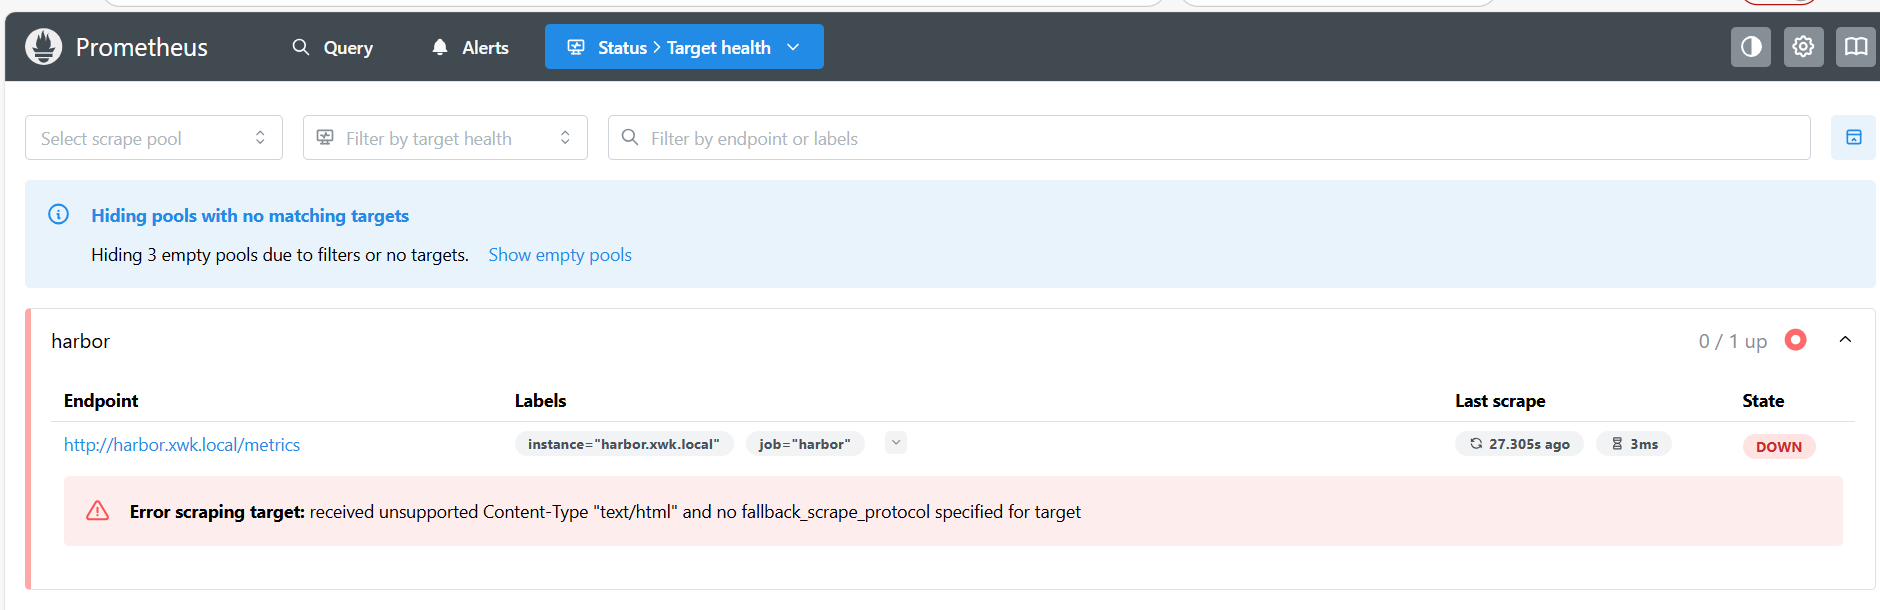
可以看出监控并没有成功,报错:Error scraping target: received unsupported Content-Type "text/html" and no fallback scrape_protocol specified for target
原因就在于没有加重定向,ingress会把访问/metrics的流量转发到80端口上,所以会出现这个问题
4、解决方法
编辑harbor仓库的ingress去添加一条规则
kubectl edit ingress harbor-ingress -n harbor
···- backend:                        # 将这个添加进去service:name: harbor-exporter       # harbor接口svc的地址port:number: 8001path: /metricspathType: Prefix···# 再试试
[root@master-11 prometheus]# curl -H "Host: harbor.xwk.local" http://10.0.0.200/metrics     # 换成你的harbor地址与IP
# HELP go_gc_duration_seconds A summary of the pause duration of garbage collection cycles.
# TYPE go_gc_duration_seconds summary
go_gc_duration_seconds{quantile="0"} 2.6613e-05
go_gc_duration_seconds{quantile="0.25"} 6.0318e-05
go_gc_duration_seconds{quantile="0.5"} 9.2387e-05
go_gc_duration_seconds{quantile="0.75"} 0.000227891
go_gc_duration_seconds{quantile="1"} 0.002910467
go_gc_duration_seconds_sum 0.007297454
go_gc_duration_seconds_count 33
# HELP go_goroutines Number of goroutines that currently exist.
# TYPE go_goroutines gauge
go_goroutines 12
# HELP go_info Information about the Go environment.
# TYPE go_info gauge
go_info{version="go1.21.9"} 1
# HELP go_memstats_alloc_bytes Number of bytes allocated and still in use.
# TYPE go_memstats_alloc_bytes gauge
go_memstats_alloc_bytes 3.237288e+06
# HELP go_memstats_alloc_bytes_total Total number of bytes allocated, even if freed.
# TYPE go_memstats_alloc_bytes_total counter
go_memstats_alloc_bytes_total 2.8977496e+07
# HELP go_memstats_buck_hash_sys_bytes Number of bytes used by the profiling bucket hash table.
# TYPE go_memstats_buck_hash_sys_bytes gauge
go_memstats_buck_hash_sys_bytes 5060
# HELP go_memstats_frees_total Total number of frees.
# TYPE go_memstats_frees_total counter
go_memstats_frees_total 155160
# HELP go_memstats_gc_sys_bytes Number of bytes used for garbage collection system metadata.
# TYPE go_memstats_gc_sys_bytes gauge
go_memstats_gc_sys_bytes 4.035304e+06
·····
这样就成功的监控了harbor仓库,若是遇到了其他的服务需要去监控,也可以通过这种方法去添加规则使访问/metrics的流量转发到正确的地方
大部分的cncf服务的values中都会有暴漏metrics的参数,将他打开,更新helm,然后在Prometheus的values中添加一条- job_name:以及后面的参数,更新完helm,添加一条重定向的规则就能成功访问
